
App Review: mySugr
App name: mySugr
Maker: mySugr GmbH
Formats: iOS, Android, and web-based
Cost: FREE / US$27.99 per year
For more information: https://mysugr.com/
MAKING BG LOGGING USEFUL again
I’ve used mySugr (Android) for more than two years. Which is an eternity when it comes to health apps. And I paid for the annual subscription most of that time. Which is a testament to how useful I find mySugr to be.
Several of my friends in the diabetes online community make a point of saying that they no longer keep a BG log. After years filled with meticulously logging BG readings and carb counts that still didn’t result in improved diabetes management, they gave up. For them logging became a judgement. So, I see you were high/low on Thursday, the 14th. What happened there? Logging is no longer a tool for planning or problem solving.
mySugr is designed to give you meaningful feedback both immediately on the screen and later in a report. It’s also designed to make it easy to enter your BG readings and other data. And you get to choose who you share your BG readings with and when.
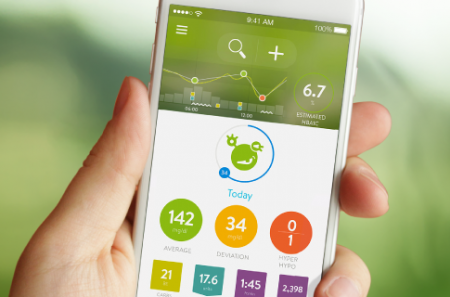
Immediate, Actionable Information
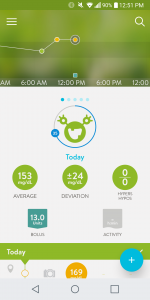
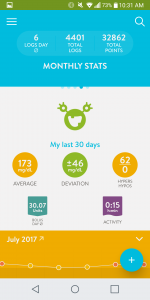
mySugr is designed to give you feedback on your entries both immediately and later in a lot of different ways. It displays raw numbers, graphs, color coding, and icons. The home screen summarizes today’s stats and by swiping left you can get to weekly, bi-weekly, monthly, and quarterly stats.
Unlike some other health apps, mySugr doesn’t hold your data hostage on your phone. You can generate a data file and either download it to your phone or email it to anyone you like. The default format is .CSV. There’s also the option to generate an Excel file. The .CSV and Excel files contain all your data but aren’t formatted into something I would call a report.
The premium version generates a formatted PDF report.
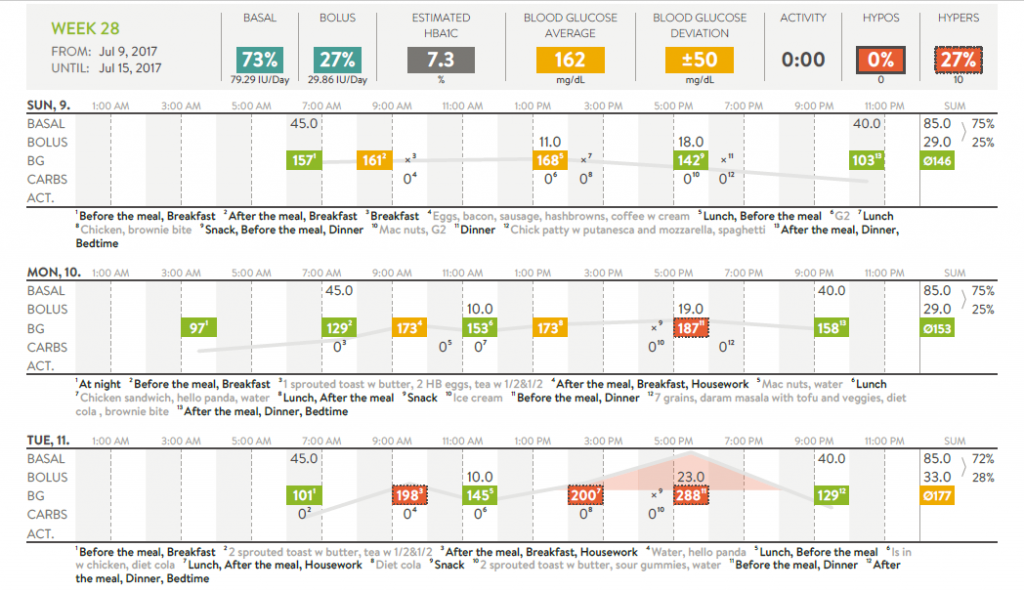
Each page of the PDF report contains a week’s worth of data graphed and formatted on a grid. At the very top there are the stats for the week: percent of insulin doses that were basal or bolus, an estimated HbA1C, average BG reading, BG deviation, total time of activity/exercise, and percent of hypos and hypers.
Each day’s entries are graphed in a horizontal stripe, making it easy to see what a particular day was like. The hours of the day are lined up vertically on the page, making it easy to see how a particular point in the day, for example lunchtime BG readings, compare over the week.
With this layout you can, at a glance, see the trajectory of a single day and patterns developing over the week. The footnotes let you dig deeper when you want, with tags like before/after a meal and text notes that you enter.
mySugr’s PDF report gives you more than the raw data. It gives you information that you can base decisions on.
MYSUGR SEttings Are comprehensive
mySugr is available both from the App Store (for iOS) and the Play Store (for Android). Downloading the app from the Play Store and installing it on a smart phone is pretty standard stuff.
Once installed, going through the settings is very important. There’s a settings section for person, therapy, and settings.
The person settings section asks for name, sex, and age.
The therapy settings section is where it becomes obvious that the folks at mySugr understand diabetes in all its permutations. For example, the drop down menu for diabetes type doesn’t just list type 1 and type 2. It includes gestational, LADA, MODY, and other. It distinguishes between insulin therapy that’s delivered via a pump or with pen/syringes. The list of insulin is extensive, so you can set it for the specific insulin you are using. There’s a section called “pills” so you can add any other medication you need to track.
The best thing about the therapy settings is you can can set your own BG target range, hypo, and hyper reading. I can’t stress enough how important this level of individualization is for digital health devices. People determine their individual target range based on their current state of health and there’s nothing more discouraging than seeing a number in red when it’s within your personal target but it doesn’t match an ideal goal.
The settings section asks what model meter and pump you are using. Again the lists are extensive. This section also asks some housekeeping questions like do you want sound effects, photos to be enhanced, and receive weekly reports and occasional newsletters via email.
LOGGING AN ENTRY Is Optimized
mySugr is designed to make logging entries easy. Not only can you type in numbers and words, but some of the fields are set up so that you can choose icons or capture photos. Photos are a premium feature.
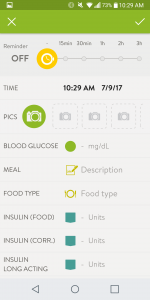
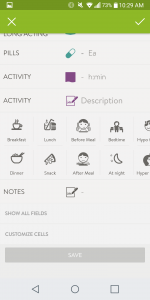
The input screen is so long it took two screen shots to capture most of it. There are more icons (breakfast, lunch, etc.) to choose from than those shown in the premium version. You just swipe left to see them.
With your smartphone’s touch screen it’s easy to navigate the logging screen. Move up and down with a swipe of your finger. With a tap of your finger you can go to the specific fields your want to enter and skip all the rest.
Entering your readings and notes works pretty much as expected. Tap on the item you want to enter, type the number/note or tap the icon(s) you want, tap “Save” at the bottom or the check mark at the top of the screen, and your done. Your entry is saved.
The use of icons makes tagging entries quick and standardized. There are icons for details like food type, before/after a meal, hyper/hypo feeling, and mood. The free version has a limited set of icons (before/after meal, breakfast, lunch, dinner, snack). The premium version includes an extensive set of icons that cover exercise, mood, illness, and special occasions.
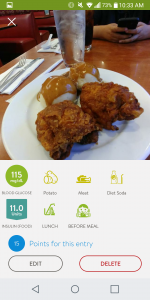
The premium version includes the ability to log a photo. The most obvious use for this is to capture a photo of a meal so that you can go back later and make note of the details. But photos are also useful as memory joggers for exercise or other medications/treatments that aren’t part of your normal routine.
Join the Million MySugr Registered Users
If you’re looking for a comprehensive, easy-to-use logging app to help you manage life with diabetes, then I recommend mySugr.
It’s a well designed app that can help you capture, analyze, and report all the data and details that go with managing diabetes. If you are living with more than diabetes, chances are that you can use mySugr to track other medications/treatments, changes in mood, etc. as well.
Two things make paying for the premium version well worth the US$27.99 per year: being able to capture photos and the formatted PDF report. Photos are quick, making it possible to capture an image instead of interrupting what you’re doing to type in a note. And the PDF reports are easy to share and easy to understand. After sharing my PDF report with my diabetes nurse she said it made her job easier.
# # #
You can read the story behind how mySugr got to one million registered users at https://diatribe.org/diabetes-app-mysugr-passes-one-million-registered-users.
UPDATE: As I was working on this review the folks at mySugr GmbH announced that they had been bought by Roche. The announcement said that mySugr will continue to operate autonomously and remains committed to being an open platform.
DISCLOSURE: I’ve used the Android version of the mySugr App for more than two years, paying for the annual subscription. While testing out the Accu-Chek Guide blood glucose meter and its integration with mySugr I let my subscription expire so that I could see how well that integration works.

Corinna:
I have not been able to get my head around mySugr, I thought it just required too much data to be useful. I tend to want software to work in my background and when I tried mySugr I thought it was too much work for too little gain. I did not try the pro version so maybe I will give it a go.
Oh, and by the way, that chicken looks amazing.
There is a learning curve and it takes a little time to figure out what info is most useful. The premium edition does give you more icons and the camera. So there’s more items that can be logged with a single tap or snap.
Honestly, I use the camera a lot and only sometimes go back to type in the details. For the screenshots I wanted to show the most info so I went back and added the details.
And, yeah, that chicken was yummy. 😉